COVID-19
Data Visualization
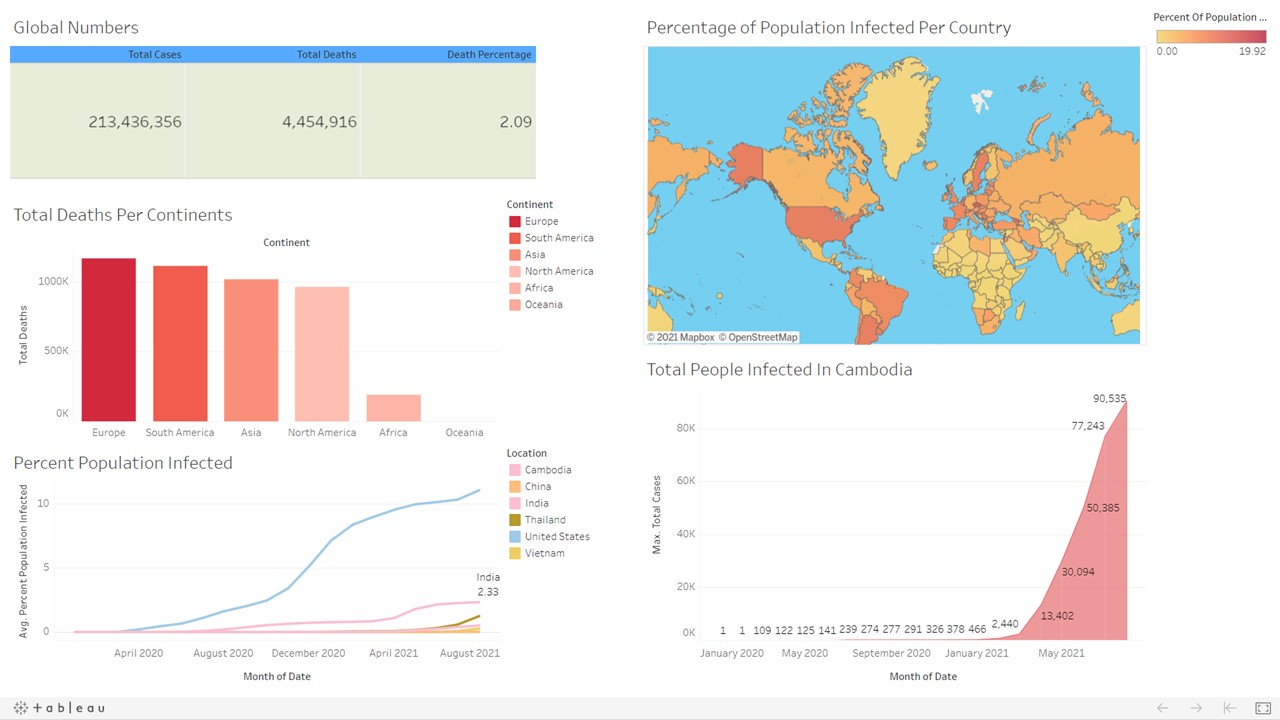
Visualize data of global Coronavirus infection rates, and deaths rates by using a Tableau desktop.
Visualize data of global Coronavirus infection rates, and deaths rates by using a Tableau desktop.
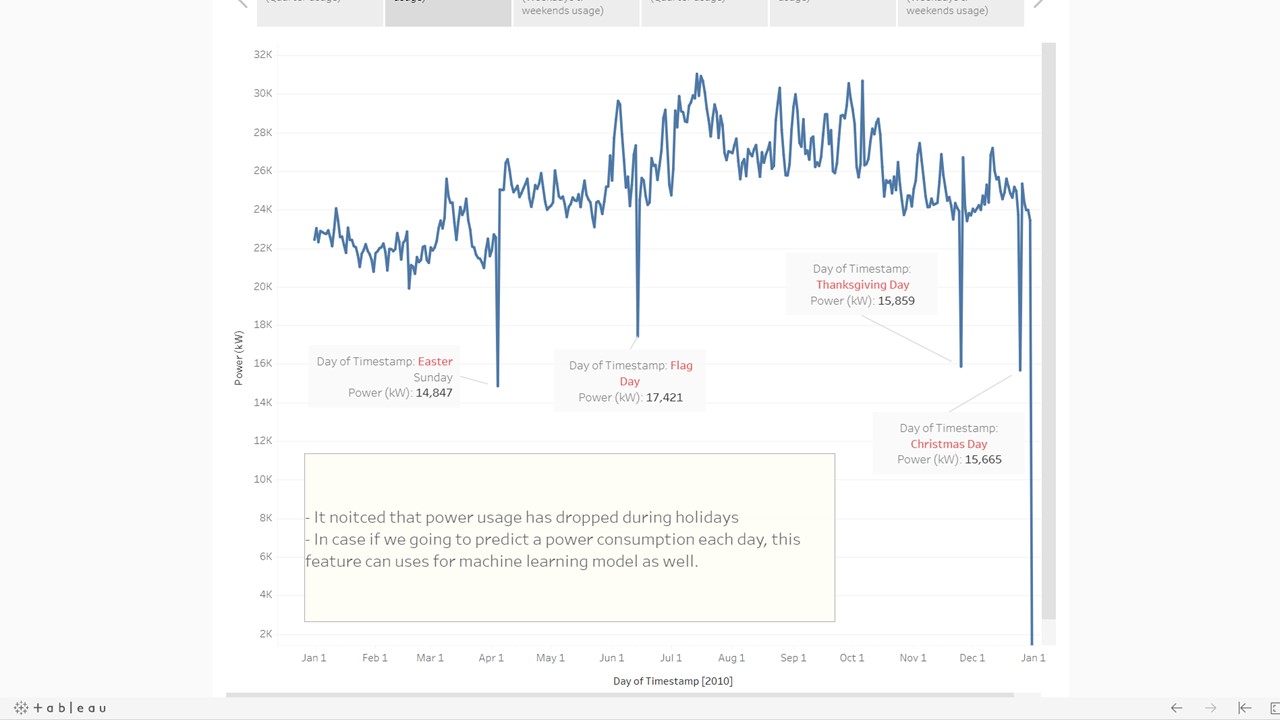
Visualize the electricity consumption data of retail and office buildings.

Explore data of global COVID-19 infection rates, vaccination rates, and death rates by using a SQL along with SQL Server.
Explore a behavior of electricity usage between retail building and office building by using a Python and Jupyter-Notebook.
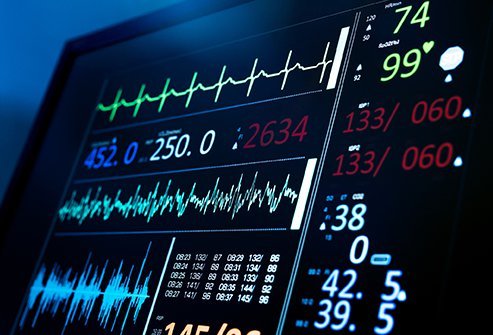
Early identify heart diseases can help clinical lower a fatality rate of a patient and different heart disease needs different treatments. The most common and popular approach use for detecting heart diseases is deep learning apply to classify and detect electrocardiogram signals of patients. In this project, a deep neural network technique is applied to distinguish between five classes of heart diseases.
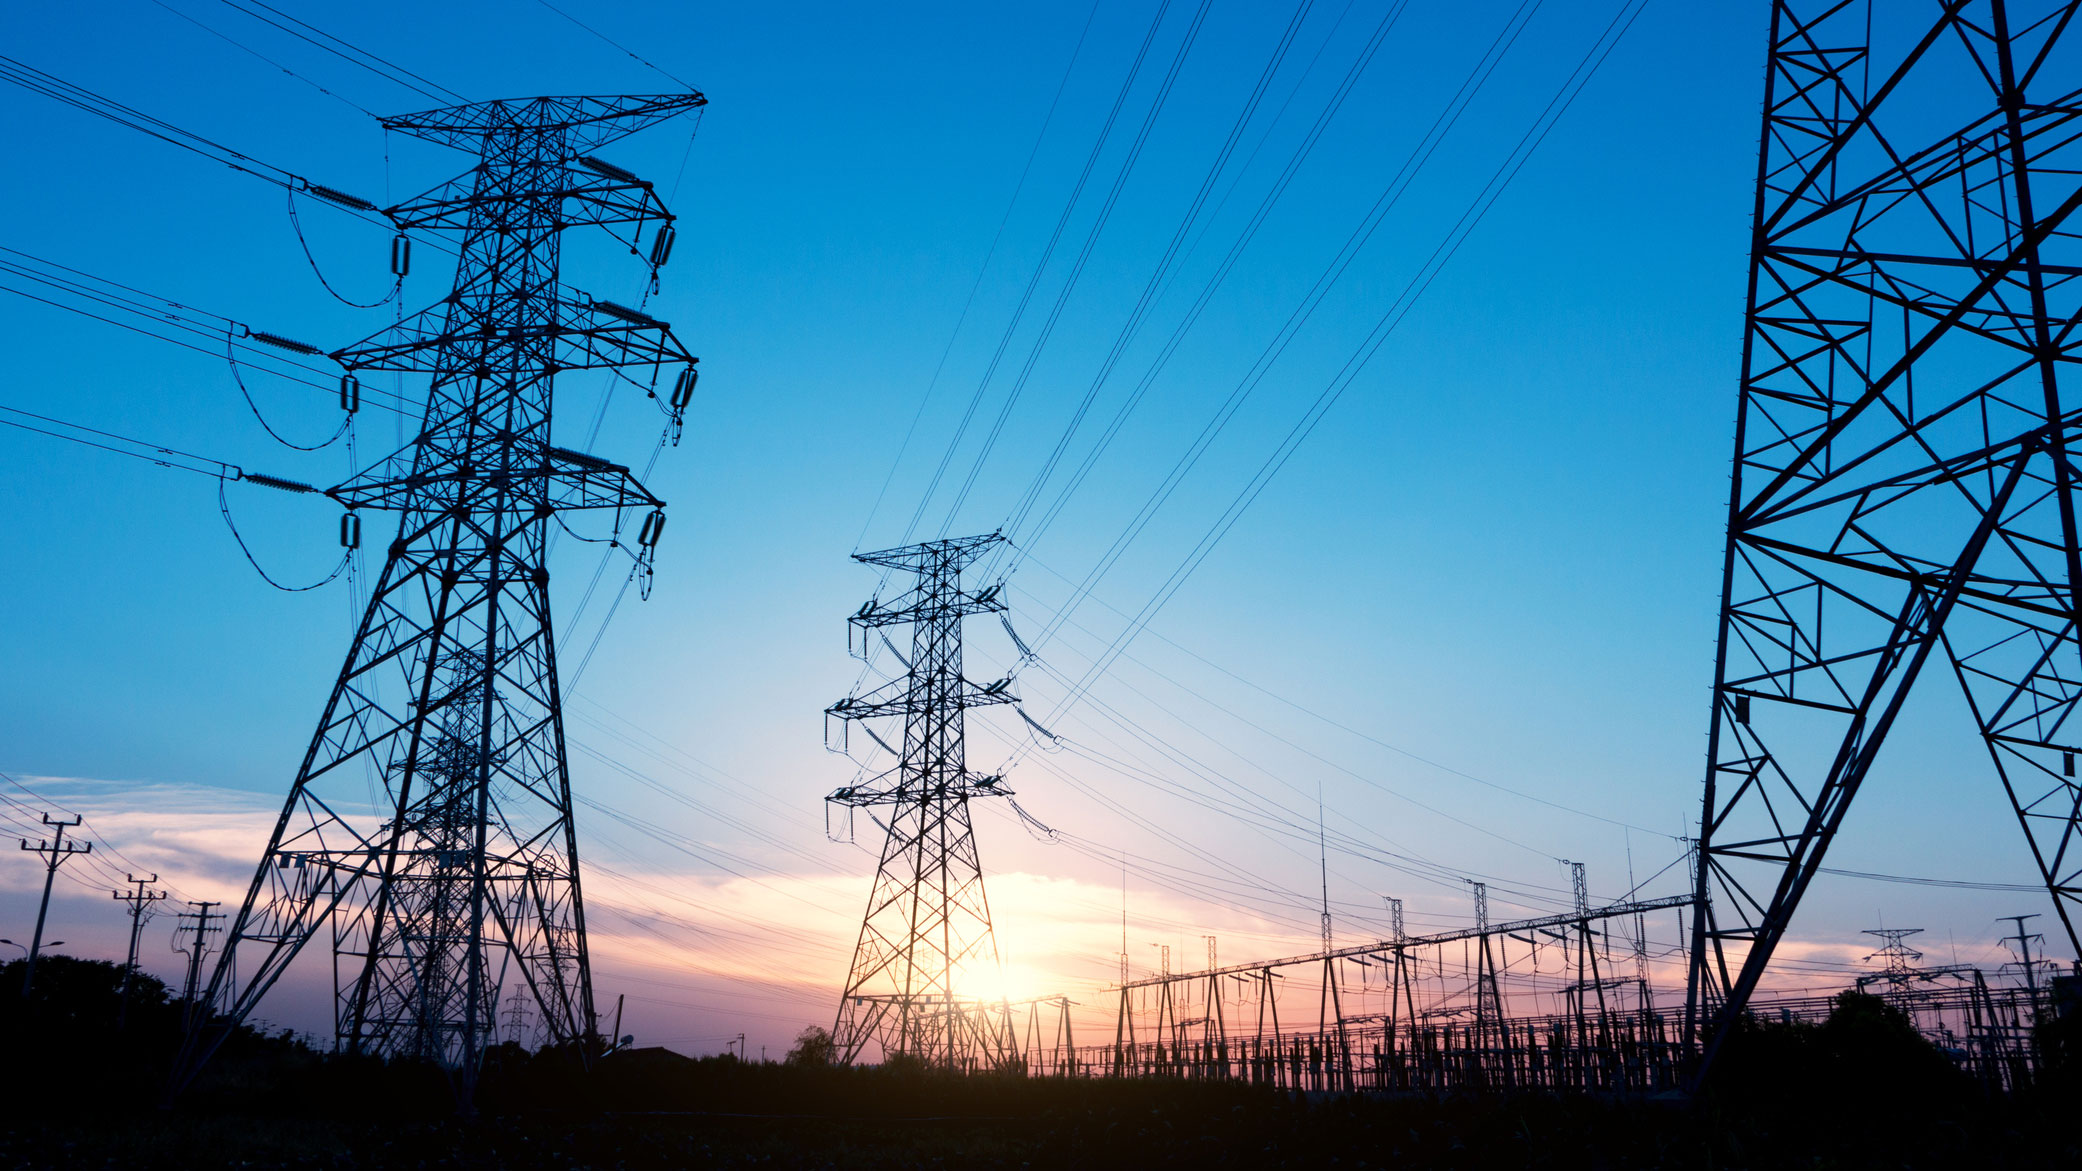
Predict the future of electric power usage is useful. It can help prevent a power loss or failure which could happen by over or lower supply the power to meet a demand of the consumer. Furthermore, it also can save consumer and supplier costs of electricity as well. In this project, a deep learning (LSTM network) approach is applied to forecast the electric power consumption of commercial buildings in the United States.